
Data Analytics in Policing
March 2015


As a nonprofit digital agency, DEV are often asked about data and analytics by our charity partners. Whether we’re building a new website or designing a digital report, our partners want to know how they can use digital to find out about their target audience.
Retrospectives (or ‘retros’) are a meeting format that allows us to review a project once it’s complete. During a retro, we look at what worked well and what worked less well. We then use this as a starting point to identify ideas for improvement, and define next steps.
In September, we decided to run a retro on data and analytics for nonprofits. Our aim was to understand the why behind nonprofit data collection, and learn how we can best support our partners to keep their mission and purpose at the centre of the work they do.
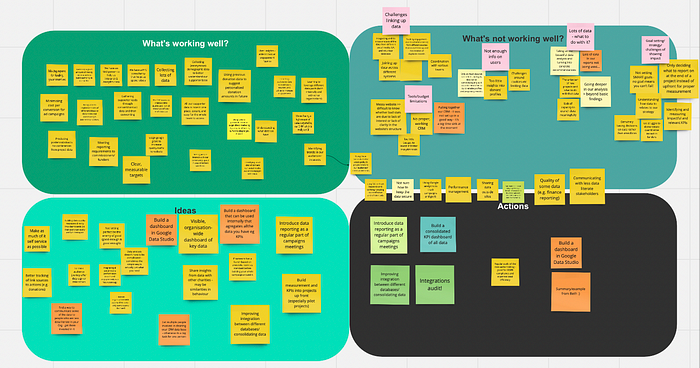 Data and analytics retro board on Miro
We were joined by around thirty organisations who shared their experience and ideas. A huge thank you to everyone who joined and contributed!
Here’s what we learnt.
We started by mapping what data was being used for by the organisations in the room.
This led us to identify three different thematic areas:
This included creating reports for donors, supporting new ideas and segmenting audiences — for example by donation amount. Data was also collected to provide stats for press releases, or to measure impact in support of a campaign.
2. Strategy
Participants explained that they used data to understand where there’s high demand for services, and used this to inform their strategy. They were also able to use data to understand how people interacted with their communications, and to compare trends in their data with ‘world trends’
“As a Digital Comms officer, I mostly compare current trends on my charity’s website with world news and base my advice to the organisation at large on my conclusions”
3. Performance Management
The third area was performance management — making sure they were meeting their goals, managing volunteers and supporting logistics.
We then asked about the how — the tools that were being used.
The short answer here was ‘Google Analytics’! Insight tools from social media platforms were also mentioned.
Next, we asked about what was working well, and what wasn’t working so well.
When we start to talk about data, we often think about the technology behind data collection. So it was a pleasant surprise that people got a big shout out — high fives to the data people out there!
“We have an SEO person who does a great job helping us analyse our Google Analytics”
“Our CEO is really supportive — this demonstrates that our organisation buys in to data”
2. Audience
The second theme that emerged was about using data and analytics to understand their audience.
Charities are using data to better understand their supporter base, personalise their campaigns and look at levels of engagement. Data can also help them to identify trends — understanding why people engage in the first place.
“Because we can understand what our supporters are interested in, we can make sure our policy responds to their interests and has their support”
3. Reporting
Not surprisingly, reporting was a big theme. Some organisations mentioned that they were only collecting data for the purpose of reporting to funders requirements.
However, others mentioned that data helped them to ensure they were setting clear, measurable targets to support their projects. We also heard about how data could play an important role in communication, improving engagement with complex topics.
“The data we collect helps us to report to our funders and, in turn, access more funding!”
There was less coherence about what wasn’t working for the sector. Here, the main challenges included: linking up data, limitations with the tools people were using and demonstrating impact. Contradictorily, not enough data and too much data were also listed as challenges!
Collecting data isn’t the same as analysing it, and people raised concerns about how data was being interpreted. This included not having enough budget to invest in tools, not having a CRM or not having an easy to use website — all of which placed limits on the usefulness of the data
“Our website is messy — so it’s hard to know whether our bad stats are due to a lack of interest or a lack of ability for people to find information!”
2. Linking up data
There were lots of challenges around integrating analytics tools with different systems and databases. People also noted that mistakes such as duplicating data entries when working across multiple systems could lead to misleading data.
“Because engagement comes from different sources, we’re creating duplicate records which leads to a lot of confusion!”
3. Demonstrating impact
We heard how sometimes the need to demonstrate impact could lead to data being manipulated or poorly interpreted. People also commented that sometimes they don’t decide what to report on until the end of the project — at which point it’s too late to collect data in any meaningful way, and often the data that has been collected is made to fit the purpose.
“No goals mean you can’t fail….! But if you don’t set these up front it also makes it challenging to measure impact”
4. Not enough data or too much data
Some organisations commented that they could only collect so much data — and this meant they were lacking the insights they needed. For others, the challenge was actually using all the data they collect, or having the time they needed to go deeper into their analysis.
“The need for proper analysis is greater than our need to report these headline basic findings — but we often lack the time and resource”
During the final part of the retro, we shared ideas and actions. This step is about applying the learning from the retro and understanding how we can improve our work. I’ve summarised the ideas and actions below.
Finally, we looked at actions. What steps could we take to improve how organisations are using data?
Some of the actions people committed to at the retro included:
During the retro, we realised just how much knowledge our charity partners already have about data and analytics. More than anyone else, they understood exactly how data was being used — for better or worse.
However, the big questions and ‘unknowns’ that emerged were around the ‘why’ of data collecting and the how. We reflected that it’s often the human element that gets missed and that there can be a disconnect between the aim of data collection and the tool that’s used.
For example, website analytics can give you a good idea of your audience size, but conducting a survey will give you a richer insight into the profile of your audience.
At DEV, it’s also important for us to consider the ethics of data collection. We want to make sure our partners understand how they are managing data, and this includes understanding exactly what data they’re collecting. By communicating this to our partner, we hope that the data that’s collected can have more of an impact, and to avoid that problem of having ‘too much’ data!
Originally posted here
March 2015

June 2016

February 2020
